See where your SOC is ready for automation
Your SOAR runs the playbooks you have built. The hard part is knowing what to automate next.
Qevlar Automations help you find that, from your own evidence. It is a new set of capabilities in Qevlar, and you are among the first we have opened it to.
Because Qevlar investigates every alert and records how its verdict compares with your analysts' decisions, it groups similar alerts and shows, per group, how consistently it agrees with your team.
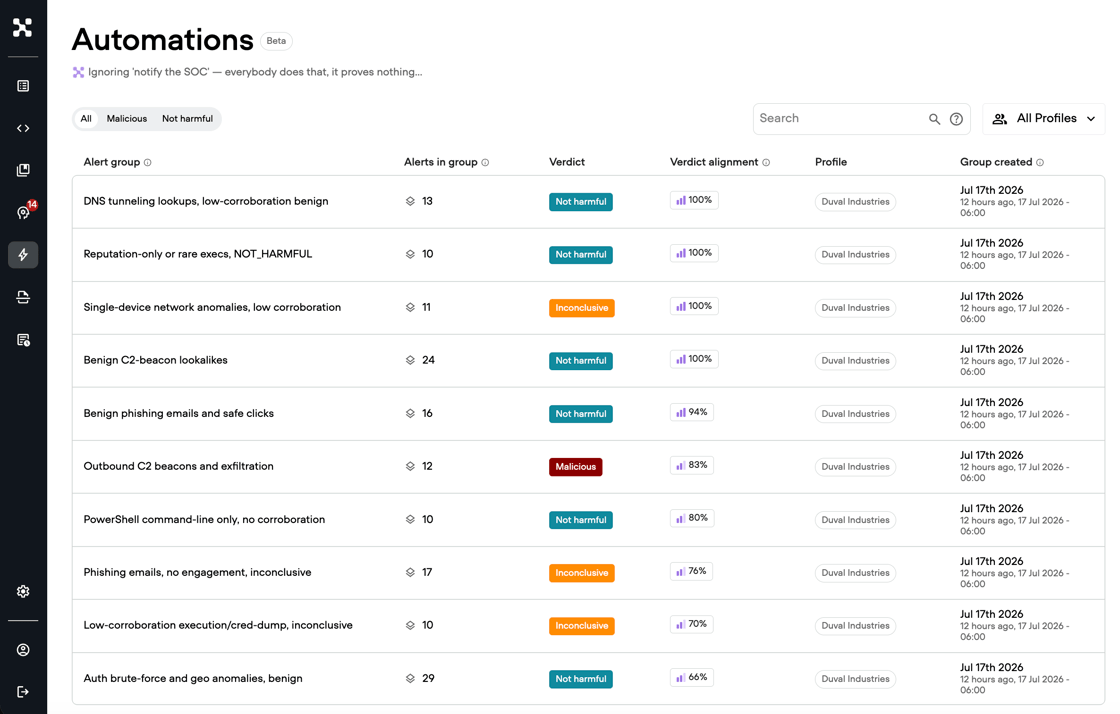
You see where Qevlar has reliably matched your analysts, rather than guessing. For example, a group of phishing alerts where verdict alignment between Qevlar and your analyst is 100%. That is a strong candidate to automate, and you can see it from your own data.
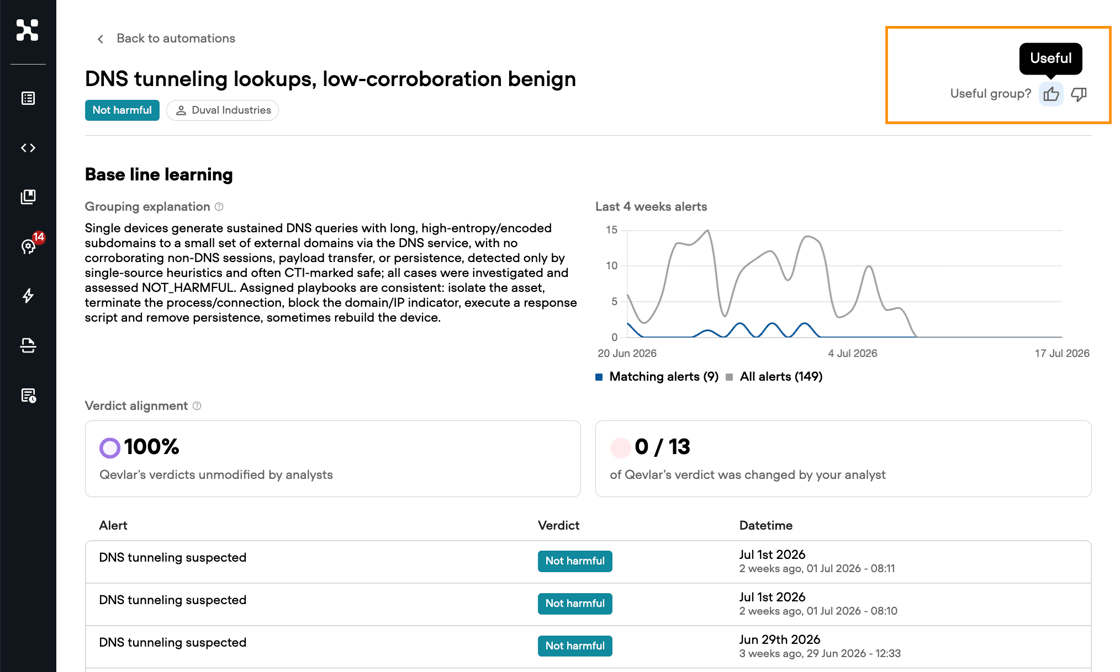
Check it out today and tell us whether the created groups reflect categories that make sense for your team. Your feedback directly contributes to how we build the product.
See your automation candidates →
Also available via APIs. Find out more here
Apply context to thousands of assets at once
Managing thousands of assets shouldn't require thousands of context items. Apply context once to an IP range or naming pattern, and every matching asset automatically inherits it.
Instead of creating one context item per entity, Qevlar now supports CIDR ranges for IPs and wildcards for hostnames, domains, and usernames. Define context the same way your infrastructure is organized: 10.20.0.0/16 for a scanner subnet, jumpbox* for bastion hosts, or svc* for service accounts.
.gif?upscale=true&width=1120&upscale=true&name=context%20patterns_4%20(1).gif)
The result is less maintenance, fewer gaps, and context that automatically stays up to date as your environment changes, whether you're managing DHCP pools, autoscaling infrastructure, or ephemeral VDI.
See what's improving across your SOC
How much time is Qevlar actually saving your team? Which context is improving investigations? Where are analysts still spending time?
The new Insights dashboard answers those questions in one place, so you can measure SOC performance, demonstrate ROI, and identify where to improve next.
.gif?upscale=true&width=1120&upscale=true&name=insights_fast_intro%20(1).gif)
- Overview quantifies alert volume, false positives reduced, conclusive rate, MTTI, and analyst hours saved.
- Organizational Context shows which context items are improving investigations
- Source & Exposure highlights your most targeted users, highest-risk entities, and noisiest rules, so you know where to focus hardening efforts.
Insights is available per tenant and visible to Admin users.
See Insights in your account →
Two new connectors
- Investigate Elastic Security alerts and automatically retrieve relevant log data during every investigation.
- Investigate Sekoia.io alerts and automatically pull the related log data to reach a verdict.